This work package refers to the development of numerical and experimental methodologies that will facilitate the activities of subsequent WPs by the project partners.
Flow-Imaging Platform is upgraded and combined with a custom-made, meso-scale fluidic and thermal experimental setup. The main goals are:
-
- Enable laser-induced fluorescence (LIF) imaging to resolve the spatial temperature distribution within the flowing coolant.
- Enable particle image velocimetry (PIV) to assess velocity fields within the coolants in an imaginary plane parallel to the main flow direction and perpendicular to the projection of the heat-transfer surface.
- Implement precise and scalable flow control, which is compatible with a range of coolant chemistries.
- Design and build a custom mm-scale fluidic set up in a modular way, allowing the testing of a wide range of surface designs
- Set up the electronics for constant-heat-flux, point-wise heating, and temperature assessment via thermocouples at strategic locations.
For LIF measurements within non-Newtonian hydrocarbons, two promising dyes are identified; Nile Red/Nile Blue oxazone and Pyrromethene 597/BODIPY. These dyes are compatible with the coolants and feature spectral characteristics matching our optical setup. Finally, Pyrromethene 597 is selected considering the fact that it provides more intensity and a stronger temperature dependence in the range of 20-80 °C in our specific setup.
All the commercially available fluorescent particles were not stable in our hydrocarbon coolants and either formed aggregates or stuck to the walls of our setup. So, in collaborative work with the group of Prof. Perrier at University of Warwick, oil-dispersible polymer particles tailored to our needs (labelled with Rhodamine B) were developed. Rhodamine B provides a size compatible with µ-PIV, density match, matching spectral characteristics and, most importantly, provides sufficient stability. However, Rhodamine B does not provide sufficient fluorescence intensity for PIV imaging. Alternately, Mie-scattering method for the generation of signal can be explored to obtain sufficiently bright particles, with slight modification in out experimental setup. In the meantime, it is decided to proceed with the qualification of our experimental setup and surface designs with aqueous non-Newtonian liquids. Here, standard melamine Rhodamine B-functionalized particles can be resort, which prove to work well for our PIV imaging.
Experimental Setup:
Experimental test setup consists of an Imager pro X camera, a Nd: YAG (neodymium-doped yttrium aluminum garnet; Nd: Y3Al5O12) laser source (frequency doubled 532nm) and a Flow Master MITAS inverted micro-PIV platform with three linear scanning axes from LaVision. A pressure-based flow control system from Fluigent SA (LineUp pressure-control units) is used to control the flow of coolant through the setup. Heat transfer from the battery is simulated by a constant-power resistive heating element. The entire test stand is housed in a laser safety enclosure.
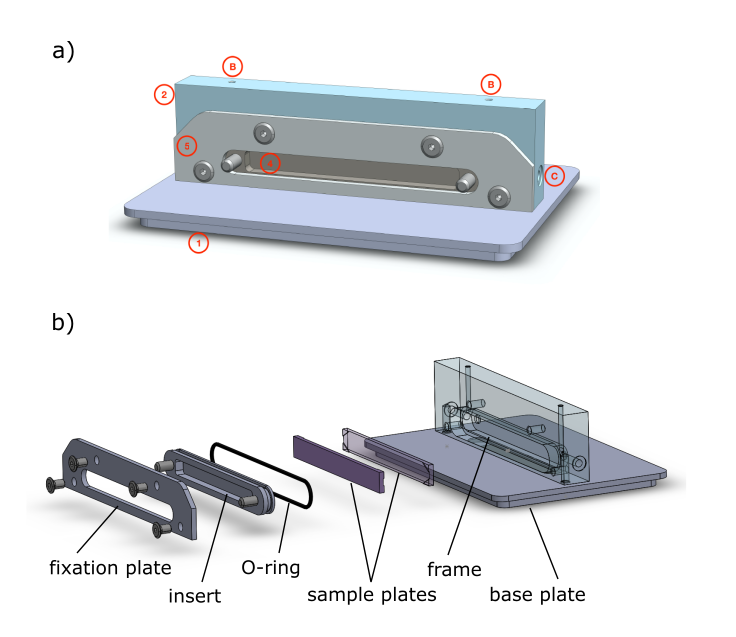
Figure 1: Fluidic setup for the study on heat transfer from structured plates to non-Newtonian coolants. a) Front view of the fluidic setup. b) Explosion view of the fluidic setup
The base plate (1) used to mount the assembly on the stage of the inverted microscope has a cutout for the operation to enable optical access (A). The frame (2) consists of PMMA and has inlet and outlet ports for the coolant on its topside (B). Temperature sensors are inserted (C) in order to measure the inlet and outlet temperature of the coolant. Two aluminum sample plates with distinct surface topology (3) are placed in the PMMA frame, leaving a 1.0 mm slit in between them for the coolant to pass. The insert (4), held in place by a fixation plate (5), seals the liquid-filled section from the front.
To optimize imaging conditions for PIV measurements, one transparent sample plate option is implemented and setup is illuminated with laser-sheet formed in the imaging plane. Further, a pulled glass micro-capillary is used to inject seeding particles directly and only in the imaging plane, which further optimizes imaging conditions.
All the defined goals were achieved except for the issue regarding PIV-tracer particles. A modular and versatile system have been setup, which enables detailed studies on the fundamental and advanced aspects of the heat transfer to non-Newtonian cooling liquids and have started evaluating different surface design using aqueous coolants.
Develop the Equilibrium Molecular Dynamics (EMD) modelling approach employing the Green-Kobo Method to derive the liquid transport coefficient.
Molecular Dynamics Simulation (MD) methodology is used to model the viscoelastic polymer solutions to find the rheological properties which are vital for immersive battery coolants. A thorough literature review was carried out to understand the advantages and possibilities of using MD to compute important properties that characterize polymer solutions. The consistency of equations of motion (first-principles methodology), and coherent treatment of different molecular species give results of MD legitimacy against empirical models.[10] The key finding of the review is explained in the following paragraphs.
Polymer solutions are modelled at various length scales depending upon the properties of interest. All-Atomic Simulation models and Course-Grained simulation models are predominantly used for the modelling of polymer solutions. In a prior method, individual atoms are considered as the basic unit (bead) and in later method different mechanics are used to represent the polymer and solvent. The United-atom model is one such mechanism, where one alkyl group or functional group is treated as a bead. All the models involve the basic units or beads interacting via bonded or non-bonded forces defined by a force field (FF). The Kremer-Grest (K-G) model uses one monomer as a bead. K-G model promises the highest computational efficiency (cheapest model), however, it faces the challenge of distinguishing the behaviour of the chemically different polymer solutions and it is a sparsely studied area. Hence, in the interest of benchmarking the simulation output with experimental values, the All-Atomistic simulation methodology is used at the beginning of the study.
Various simulations are conducted in the area of polymer solution modelling. MD Simulation software is used in both cases, Large-scale Atomistic and Molecular Modelling Parallel Simulator (LAMMPS). The input files required for LAMMPS simulation software execution are prepared using various open-source software (OSS). Software such as PACKMOL, VMD, CHARMM-GUI, ATB, MOLTEMPLATE is important elements of these workflows. Also, in-house codes using Python and C++ are developed wherever necessary to process the output of these software packages appropriately.
Characterisation of polymer solutions is done using macroscopic properties such as density, viscosity, thermal conductivity, normal stress differences, relaxation times, moduli of storage and loss, and so on. Different microscopic properties such as radial distribution function, a radius of gyration, end-to-end polymer distance, diffusivity etc. can be computed using MD. Table 1, lists then mathematical models to compute various macroscopic properties using equilibrium MD and describes the computational scheme. Refer to Figure 3 and Figure 4.
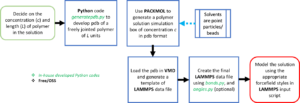
Figure 3. Workflow to execute the MD simulations using Kremer-Grest (K-G) molecular model.
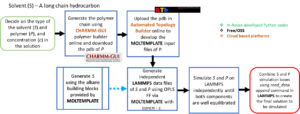
Figure 4. Workflow to execute the MD simulation using the all-atomistic model.
Preliminary studies are carried out to compute a few of the properties as described in Table 1. In one study, short polymer chains in an explicit solvent interacting via Weeks-Chandler-Andersen (WCA) and Finite Extensible Non-Elastic (FENE) potentials are simulated.[11]
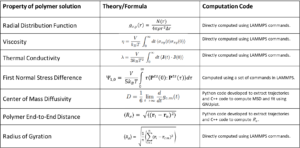
Table 1. Computation of various properties of polymer solutions using equilibrium MD simulation.
The relationship between the radius of gyration and the end-to-end distance of the polymer is shown in Figure 5. Another study is done to characterise n-dodecane, a solvent that is predominantly featured in several lubricating oils.[12] The density, viscosity and thermal conductivity computed for n-dodecane using OPLS-AA FF are shown in Figure 6.
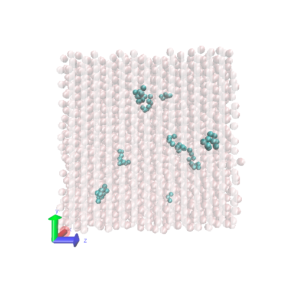
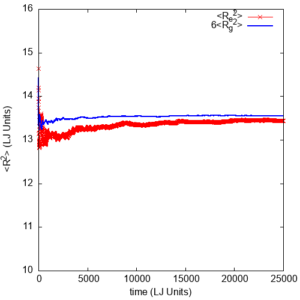
Figure 5. (Left) Simulation box consisting of polymer chains (blue beads) in an explicit solvent (background beads). (Right) The relationship between the end-to-end distance of the polymer (Re) and the radius of gyration (Rg), i.e. <Re2> ¹ 6 <Rg2>, shows that the force-field used can model excluded volume in the case of polymer solutions.
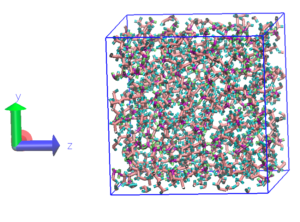
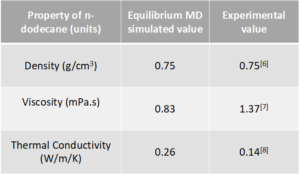
Figure 6. (Left) Simulation box consisting of 100 n-dodecane molecules. (Right) The different properties of n-dodecane were computed at 293 K and 1 atm using equilibrium MD compared with experimental values.
Further work is commissioned to investigate the relationship between shear rate and shear viscosity for the polymer solutions. The use of non-equilibrium MD (NEMD) to find properties and relationships of polymer solutions with different simulations in a reliable manner is expected to be done in the future course of work.
Setting up of PIV and thermal rigs. Design and fabrication of test pieces
PIV test rig
An experimental facility is dedicated to the investigation of the rheological behaviour of novel HR liquids by involving various optically accessible flow channels with specific geometry features. These flow channels are made of acrylic glass, which provides optimal optical properties, such as a relatively good refractive index matching with HR fluids, to ensure good optical access to the liquid flow. The geometry features designed serve to induce specific longitudinal and cross-flow vortices in the flow.
The flow channels with different geometries are planned to investigate the rheological behaviour of novel liquid coolants.
Benchmark geometry -1: Curved tube
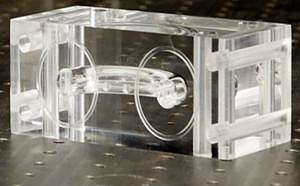
The curved tube geometry is designed as a first sample among the benchmark geometries. This flow channel represents a relatively straightforward design, where the flow is turned by 180° and is known to generate a pair of Dean vortices as a consequence of centripetal forces.
a) b)
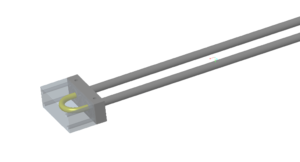
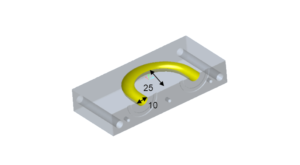
Figure 7. (a) Optically-accessible curved flow channel with supply pipes, (b) The flow channel in the cross-section
Benchmark geometry -2: Geometrical constriction
The second benchmark geometry is referred to as the geometrical constriction. This geometry induces initial flow constriction, whereas in the downstream flow an expansion takes place. Several stagnation zones are expected within this channel geometry. The flow within this geometry undergoes some changes, where the rheology of the liquid plays an important role.
a)
b)
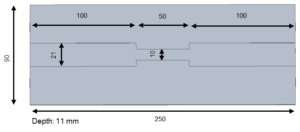
Figure 8. (a) Explosion view of the flow channel with geometrical constriction, (b) The dimensions of the geometrical constriction. Dimensions in mm.
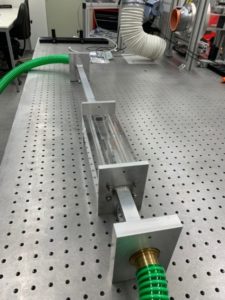 Figure 9. Photo of a flow channel with geometrical constriction.
Benchmark geometry -3: Channel with series of plates
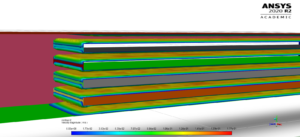
The third benchmark geometry consists out of a rectangular duct, which includes a set of four plates arranged in the main flow direction. This design allows investigating flow dynamics in conditions that to some degree simulate the flow between prismatic cells.
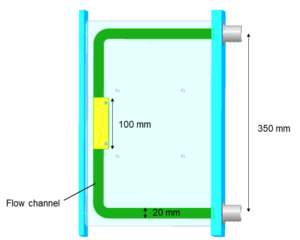
Figure 10. Schematic illustration of a flow channel with a series of parallel plates.
In this context, computational flow dynamics (CFD) is used to create an initial impression about the flow around the obstacle in the form of plates.
Two different simulations are conducted with Re=400 and Re=2000 on the same flow channel configuration to provide a rough estimation behaviour in the relevant flow conditions, which will be considered in the benchmark measurements.
a)
b)
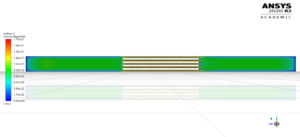
Figure 11. Numerical results of the flow for Re=400. (a) Velocity around the plates, (b) Velocity in the rectangular channel.
a)

b)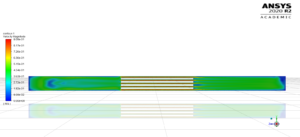
Figure 12. Numerical results of the flow for Re=2000. (a) Velocity around the plates, (b) Velocity in the rectangular channel.
Benchmark geometry -4: Bluff body
The flow over a bluff body is also considered for the experiments. The configuration of the channel with parallel plates allows extracting the obstacle. By that, another insertion in a form of a bluff body can be used in the same channel. The illustration of this body is depicted in Figure 14. The whole insertion is made of two parts that are connected. The facets of a bluff body are parallel to the channel surfaces. The length, width, and thickness are 20mm, 7.5 mm, and 7.5 mm, respectively.
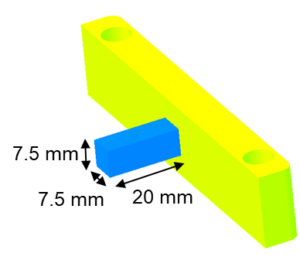
Figure 13. The construction of a bluff body.
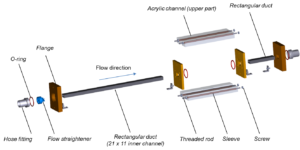
Experimental stand
The scheme of the experimental stand is shown in Figure 14. The setup consists of two parts, namely a flow loop and an optical part. The dynamic flow conditions for benchmark measurements are planned to be defined for the range of Re-number between 500 and 2000. The characteristic length is defined by the dimensions of a flow channel (or obstacle), whereas the Re-number for the channel with plates is defined based on a gap between two parallel plates.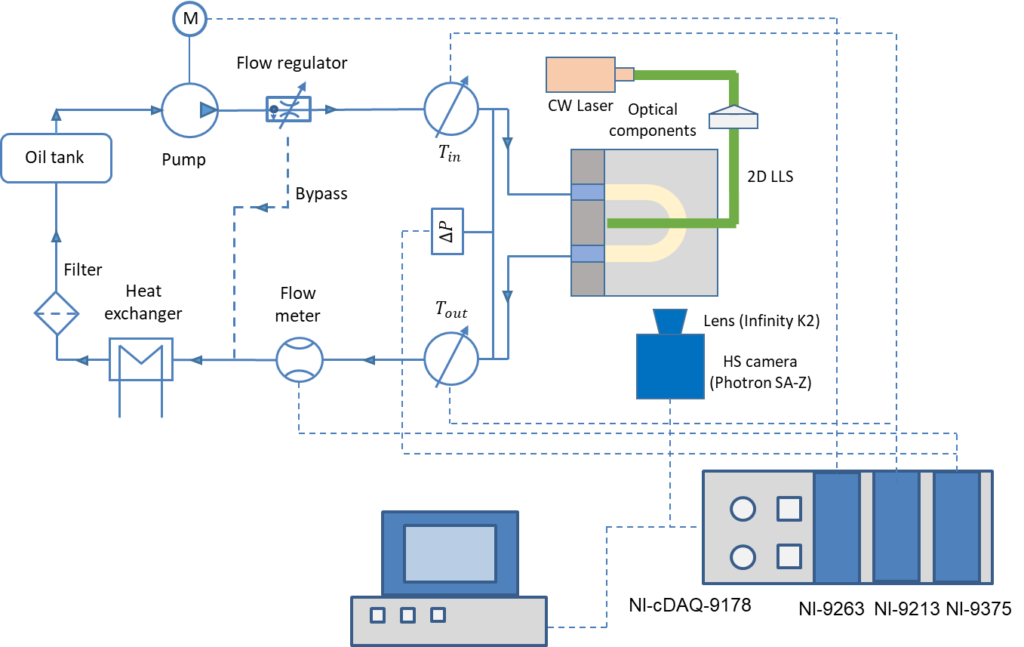
Figure 14. Scheme of the enclosed flow loop for PIV experiments.
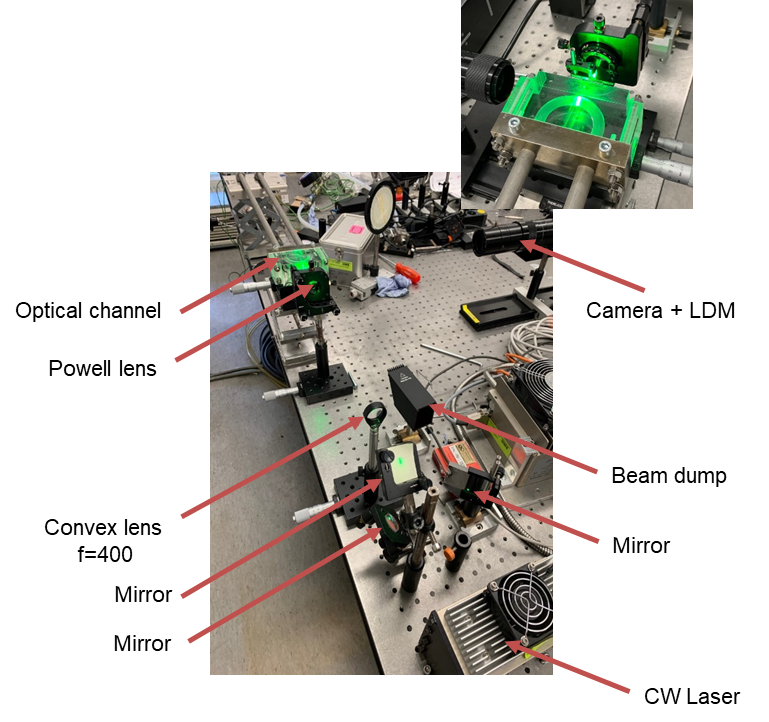
Optical part
The preliminary PIV measurements in this report are made by a CNI 1.5 W laser, which is an adjustable CW diode laser and is quite comfortable in the application. The preliminary measurements are made on the 180°-bending channel, however, a laser Conqueror CW_12 (from Compact Laser Solutions GmbH) will be used as an illumination source in the optical part later, which provides significantly higher laser power, which is required for measurements on other benchmark flow channels (with larger observation areas).
Preliminary experimental data
The preliminary experiments are performed on the abovementioned test setup. Below are several PIV results for a base oil OS131828L. The experimental data are evaluated using an open-source MATLAB code [15].
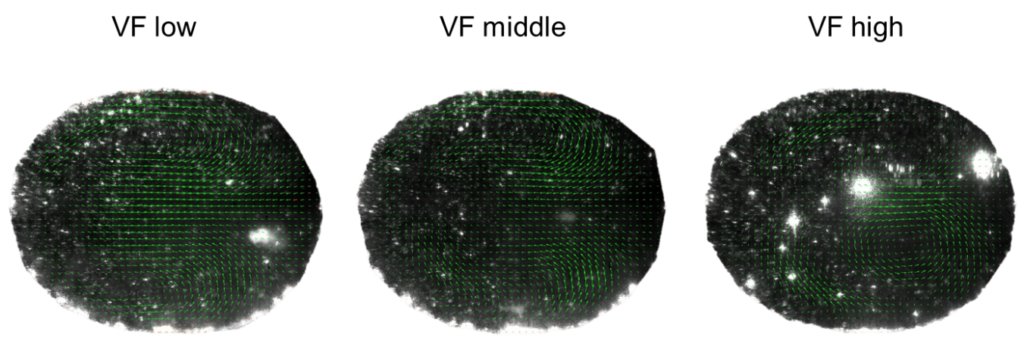
Figure15. Experimental results for OS131828L for various flow rates.
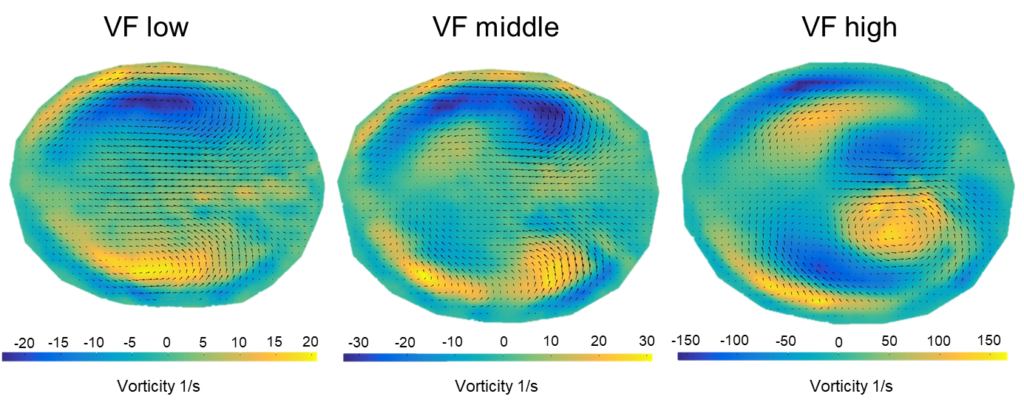
Furthermore, the experimental data are used to estimate the flow vorticity, which is depicted in fig 16. It can be observed that a higher volume flow rate induces more intense vortices. Two Dean vortices are observed for VF low and VF middle. However, for a higher flow rate, there are four Dean vortices and two counterrotating vortices that can be observed in a cross-section of a bending channel.
Thermal test rig
The purpose of the thermal rig is to evaluate the cooling performance of the investigated HR oils. An important moment is to evaluate the thermal characteristics of the moving oils in relevant flow regimes, where the Re-number varies from 500 to 2000.
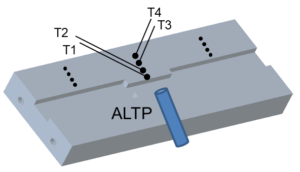
Figure17. Flow channel with the schematic representation of temperature and heat-flux sensors.
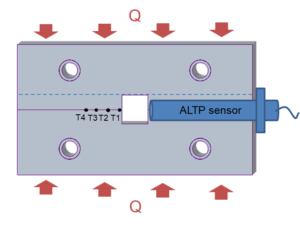
Figure 18. Cross-sectional view of the flow channel with sensors.
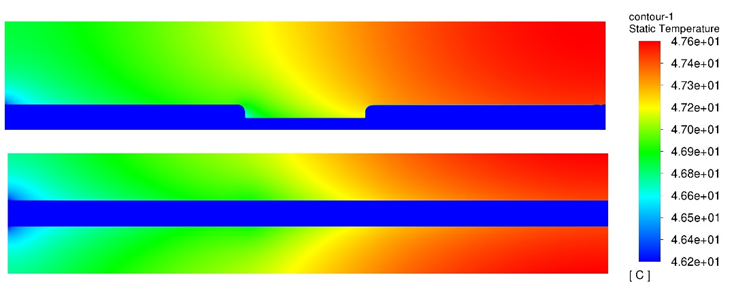
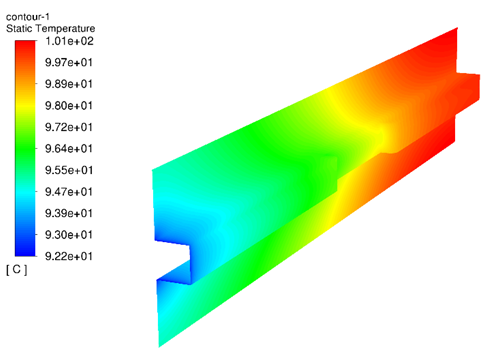
A few numerical studies are performed to estimate the temperature distribution in the metallic body under various conditions
References:
- Vincenzi, S. Jin, E. Bodenschatz and L. R. Collins, “Stretching of polymers in isotropic turbulence: a statistical closure,” Physical Review Letters, vol. 98, p. 024503, 2007.
- Trevelyan, Molecular and multiscale simulations of complex fluids (2014), PhD Thesis, Imperial College London.
- Bishop, M.H. Kalos, and H.L. Frisch, Molecular dynamics of polymeric systems, The Journal of Chemical Physics 70 (1979) 1299-1304.
- J. Covitch, and K.J. Trickett, How Polymers Behave as Viscosity Index Improvers in Lubricating Oils. Advances in Chemical Engineering and Science 5 (2015) 134-151.
- E. Simons, Comparing heat transfer rates of liquid coolants using the Mouromtseff number, Electronics Cooling 12 (2) (2006)
- Non-Newtonian flow of highly-viscous oils in hydraulic components, I. K. Karathanassis, E. Pashkovski, M. Heidari-Koochi, H. Jadidbonab, T. Smith, M. Gavaises, C. Bruecker, Non-Newton Fluid., 2020, 275, 104221
- Shudo, A. Izumi, K. Hagita, T. Nakao, M. Shibayama, Structure-mechanical property relationships in crosslinked phenolic resin investigated by molecular dynamics simulation, Polymer 116 (2017) 506–514.
- Kremer, G. S. Grest, Dynamics of entangled linear polymer melts: A molecular-dynamics simulation, The Journal of Chemical Physics 92 (1990) 5057–5086.
- Everaers, H.A. Karimi-Varzaneh, F. Fleck, N. Hojdis, and C. Svaneborg, Kremer–grest models for commodity polymer melts: Linking theory, experiment, and simulation at the Kuhn scale, Macromolecules 53 (2020) 1901-1916.
- R. Caudwell, J.P.M Trusler, V. Vesovic, W.A. Wakeham, The viscosity and density of n-dodecane and n-octadecane at pressures up to 200 MPa and temperatures up to 473 K. International Journal of Thermophysics, 25 (2004) 1339-1352.
- Tian and H. Liu, Densities and viscosities of binary mixtures of tributyl phosphate with hexene and dodecane from (298.15 to 328.15) K, Journal of Chemical & Engineering Data 52 (2007), 892–897.
- Tanaka, Y. Itani, H. Kubota, Thermal conductivity of five normal alkanes in the temperature range 283–373 K at pressures up to 250 MPa, International Journal of Thermophysics 9 (1988), 331–350.