This work package solidifies the science-to-technology transition by demonstrating the proof-of-concept of the prototype BTMS.
CFD in realistic BTMS configurations with base and optimized HTR liquids
Main objective is to couple the CFD models with the electrochemical-thermal models which accounts to the transient battery thermal behaviour as well as simulation of the actual battery configuration with different geometrical features and HTR liquid properties to identify parameters crucial to the performance of the BTMS.
Battery Modelling approach can be broadly classified in two categories: electrode-scale and battery-scale approaches. Earlier is suitable for examining phenomena that take place mainly within the batter and later one is suitable for designing BTMS, which efficiently delivers the electrochemical-thermal coupling of the battery. The Dual-Potential, Multi-Scale-Multi-Dimensional (MSMD) model treats the battery as an orthotropic continuum and the computational mesh is no longer constrained by the micro-structure of the battery. The Dual-Potential MSMD approach combines the chemical reactions (generating electricity), the electrical phenomena (due to current flow) and the generated heat (due to the electrochemical phenomena) in the following equations:
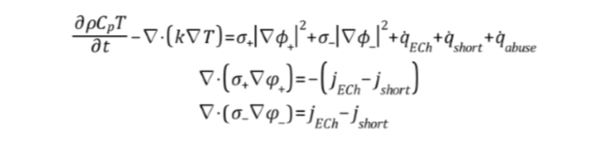
Set of Equations 1 Dual Potential Electrochemical-thermal coupling
The Set of Equations 1 has 3 equations in 3 unknowns (closed system): temperature T and the two potentials φ+ and φ– for the phase potentials of the positive and negative electrodes, respectively. jECh and qECh are source terms referring to the volumetric current transfer rate and electrochemical reaction heat due to the processes taking place within the battery, respectively. jshort and q̇short refer to the internal circuit and are usually set to 0. Finally, q̇abuse refers to heat generated due to chemical reactions under thermal abuse and is also set to 0 for the present work.
The electrochemical source terms mentioned above are obtained via an electrochemical sub-modelling procedure, which also follows different approaches depending on the limitations of the case of interest. Here, the physics-based, semi-empirical model of Newman, Tiedemann, Gu, and Kim (NTGK) is employed, as proposed by Kwon et al [1]. The model employs material properties and other parameters depending on the depth of discharge (DoD) and the temperature of the battery to evaluate jECh and qECh. These parameters are battery-specific and must be accurately input for the battery simulations to be reliable.
To understand the electro-chemical behaviour of the battery, simulation of single, standalone battery cells have been conducted with a single lithium-ion, manganese oxide (LMO) battery cell with nominal capacity of 14.6 Ah was discharged at different rates ranging from 1 to 10 to evaluate differences in the resulting temperature fields. Next, the same battery cell was immersed in a fluid region and the electrochemical-thermal battery model was coupled with the flow solver.
Figure 1 presents the LMO cell immersed in stagnant air (left), moving air (middle) and moving non-Newtonian fluid (right) provided by Lubrizol, all discharging at a rate of 10C. Non-Newtonian fluid reduces the temperature to a great extend compared to air flow while at the same time maintaining an almost uniform and vertically symmetric temperature distribution across the cell.
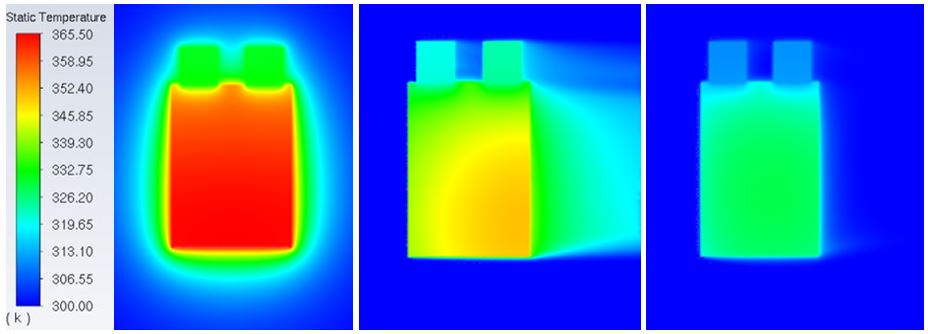
Figure 1 Temperature contours of a single battery cell discharged at 10C and immersed in stagnant air (left), moving air at MFR = 0.18 kg/s (middle) and moving non-Newtonian fluid at MFR = 0.18 kg/s (right).
Following the above set of simulations is the investigation of an actual battery cell (and later of an actual pack consisting of a number of battery cells) provided by the industrial partners. fig 2 illustrates the CAD design of a single LFP battery cell with a nominal capacity of 40 Ah. As mentioned earlier, special care should be taken regarding the battery-specific parameters of the electrochemical sub-modelling. For the NTGK model used here, these parameters can be extracted from voltage-vs-time experimental curves. This requires that experimental data of the battery cell charged and discharged at various C-Rates are input in the numerical solver. For that purpose, a robust approach is being developed that would allow for direct input of all the necessary parameters of standard chemistry types of Li-ion cells under investigation.
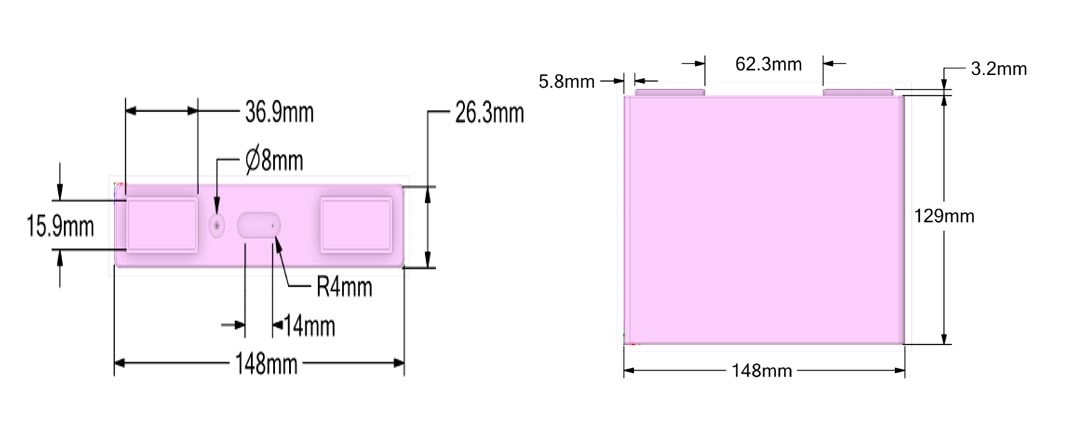
Figure 2 Dimensions of a single LFP battery cell.
Design and testing of BTMS
Special cell is drafted with a set of specification to develop a battery module that benefits in a special way from superior cooling and thus serves as an ideal concept demonstration. The module’s target specification are high charge and discharge rates up to 6C, that are highly determined by cooling, as well as a compact design. The cooling concept is based on a controlled fluid flow around the cells with constant spacing and includes surface engineering, thus a hard-shell prismatic cell was pre-determined. Additionally, the final demonstrator should have a high number of thermocouples and a tailored BTMS unit.
Cell selection
Based on the given specifications four different cell with short- and medium-term availability. 1-GWL-ZG-LFP020AH, 2-SIG LFP40, 3-SIG L148N50B, 4-GWL-IFPP50 with different capacity, voltage range, chemistry, discharge and dimensions.
The selection options are focused by the consortium on cells two and three due to larger welded tabs in comparison to screw connections. Finally, cell 2 SIG LFP40 is selected, due to the higher possible charge and discharge rates and the safer LFP chemistry, see Figure 3.

Figure 3. A photo of the LFP40 cell.
Cell testing
In the next step, LEP40 cell is tested. The cell is heated through one of the terminals, while the temperature of the cell is monitored by ten thermocouples. From the time-resolved data, a mapping of the heat capacity can be derived. Additionally, the cell is connected via contact electrodes, Different charge and discharge loads are applied. Again, a number of thermocouples monitored the cell temperature. The time resolved data form the charge and discharge rates is used in the battery cell simulation as boundary condition. Figure 4 represents an example data set.
a) b)

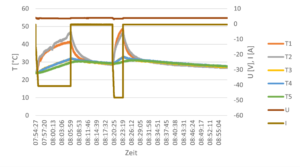
Figure 4. (a) Location of thermocouples and (b) resulting temperature profiles while discharging at 50 A including cool-down.
Finally, the cell was 3D scanned in a CT to visualise the internal structure to help setting up the battery model, see Figure 5.
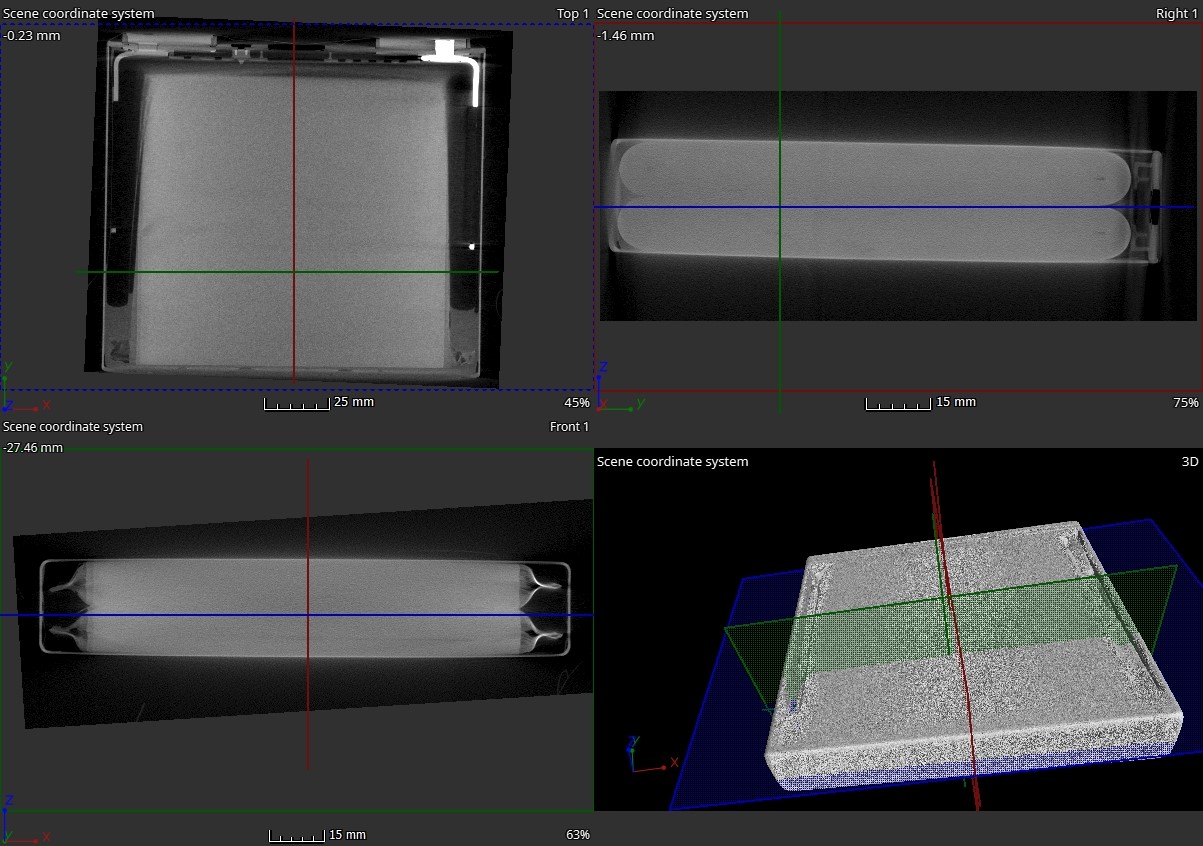
Figure 5. CT scan of the SIG-LFP40 cell.
References:
- Kwon, Ki Hyun, et al. “A two-dimensional modeling of a lithium-polymer battery.” Journal of Power Sources 163.1 (2006): 151-157.